Using Monte Carlo Simulations to Calculate Lottery Odds
Ever wondered if you could crack the code to winning the lottery? While there’s no surefire way to guarantee a jackpot, data enthusiasts can still explore the odds and strategies using Python. Let’s dive into a fun experiment to understand the probability of winning using Monte Carlo simulations, all in a Jupyter Notebook!
Step 1: Setting Up Your Environment
Ensure you have Python installed, along with Jupyter Notebook and essential libraries like numpy, pandas, and matplotlib.
pip install numpy pandas matplotlib jupyter
Step 2: Simulate the Lottery Draw
In a standard lottery, you pick 6 numbers out of a pool of, say, 1 to 49. We can simulate this using Python:
import numpy as np

# Simulate a single lottery draw
def lottery_draw(pool_size=49, pick_count=6):
    return set(np.random.choice(range(1, pool_size + 1), pick_count, replace=False))

# Example: Simulate a draw
print("Lottery draw:", lottery_draw())
Step 3: Run the Monte Carlo Simulation
Now we’ll run thousands of simulations to see how often we would win.
# Simulate multiple lottery plays
def monte_carlo_simulation(pool_size=49, pick_count=6, trials=100000):
    winning_numbers = lottery_draw(pool_size, pick_count)
    wins = 0

    for _ in range(trials):
        player_numbers = lottery_draw(pool_size, pick_count)
        if player_numbers == winning_numbers:
            wins += 1

    win_probability = wins / trials
    return win_probability, wins

# Run the simulation
probability, total_wins = monte_carlo_simulation()
print(f"Out of 100,000 trials, we won {total_wins} times.")
print(f"Estimated probability of winning: {probability:.10f}")
Step 4: Visualize the Results
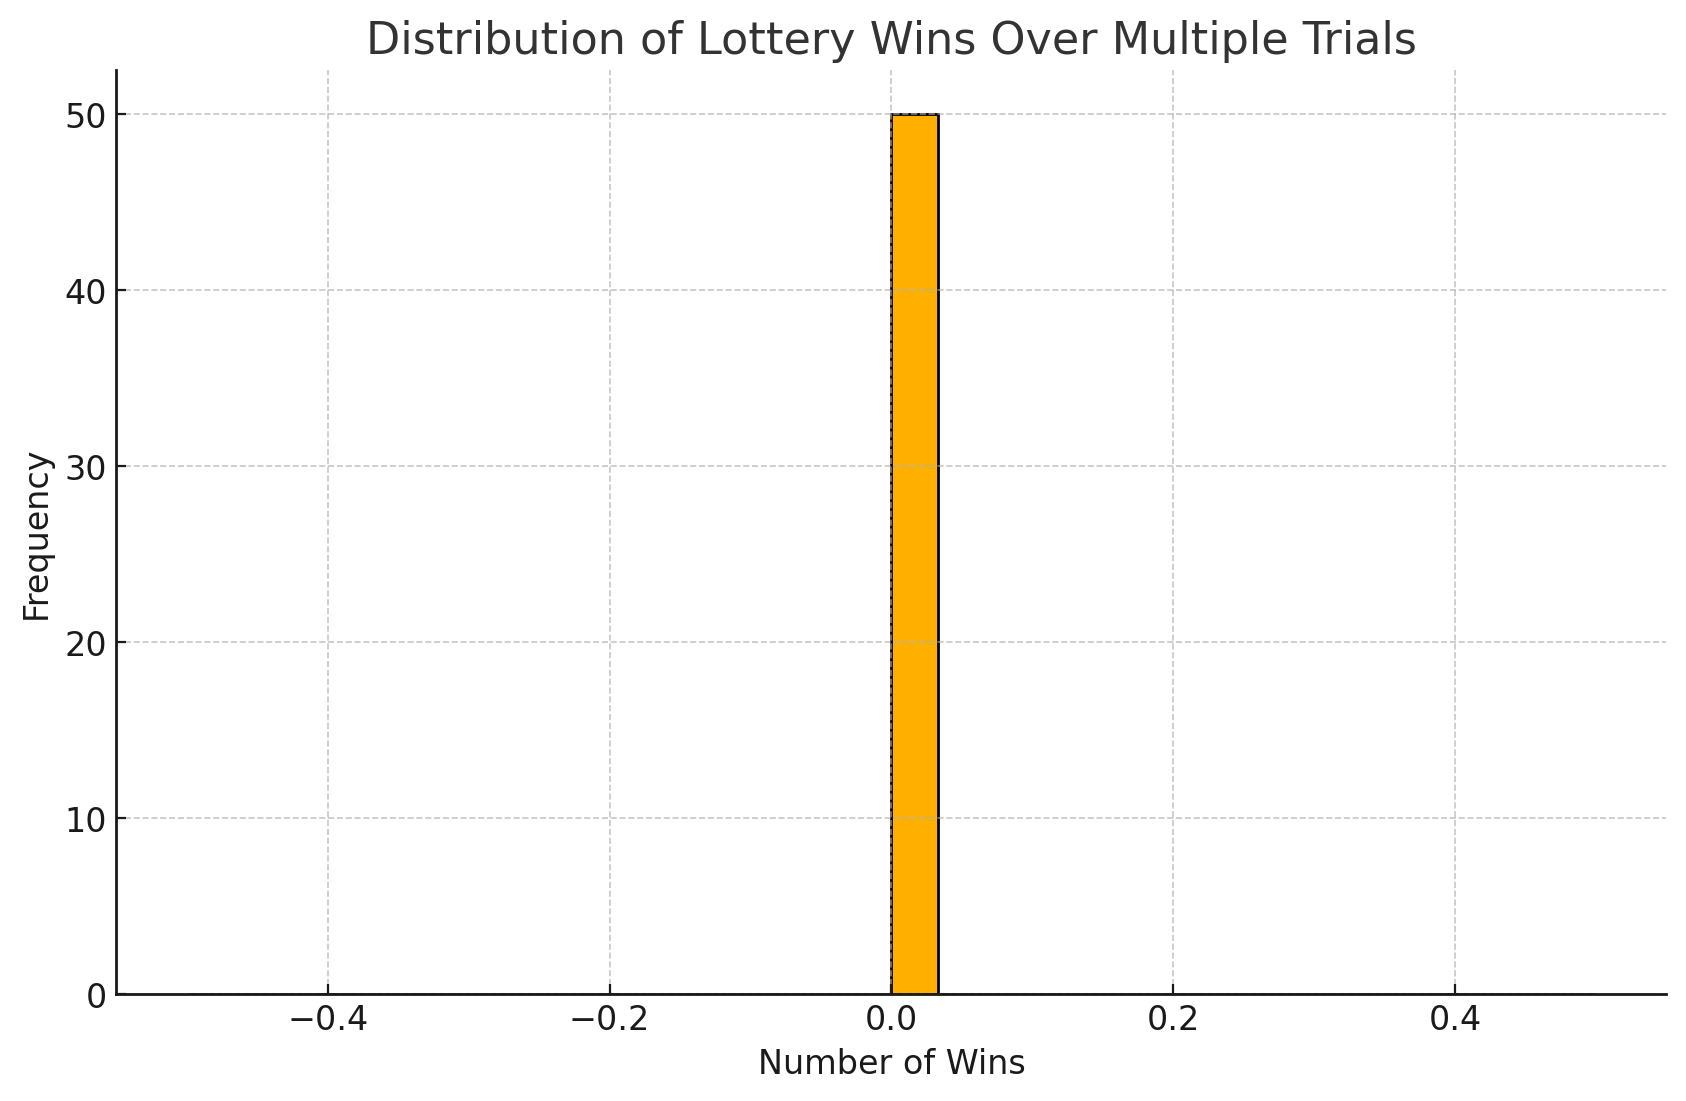
Adding a visualization helps illustrate how rare it is to match all numbers.
import matplotlib.pyplot as plt

# Generate a histogram for visualization
def plot_simulation_results(results):
    plt.hist(results, bins=30, edgecolor='black')
    plt.title('Distribution of Lottery Wins Over Multiple Trials')
    plt.xlabel('Number of Wins')
    plt.ylabel('Frequency')
    plt.show()

# Run and plot multiple simulations
results = [monte_carlo_simulation()[1] for _ in range(50)]
plot_simulation_results(results)

The simulation will reveal that winning the lottery is exceedingly rare, reinforcing why it’s often said that the best way to double your money is to fold it and put it back in your pocket. But running these types of experiments is a great way to hone your data skills and have fun while doing it!